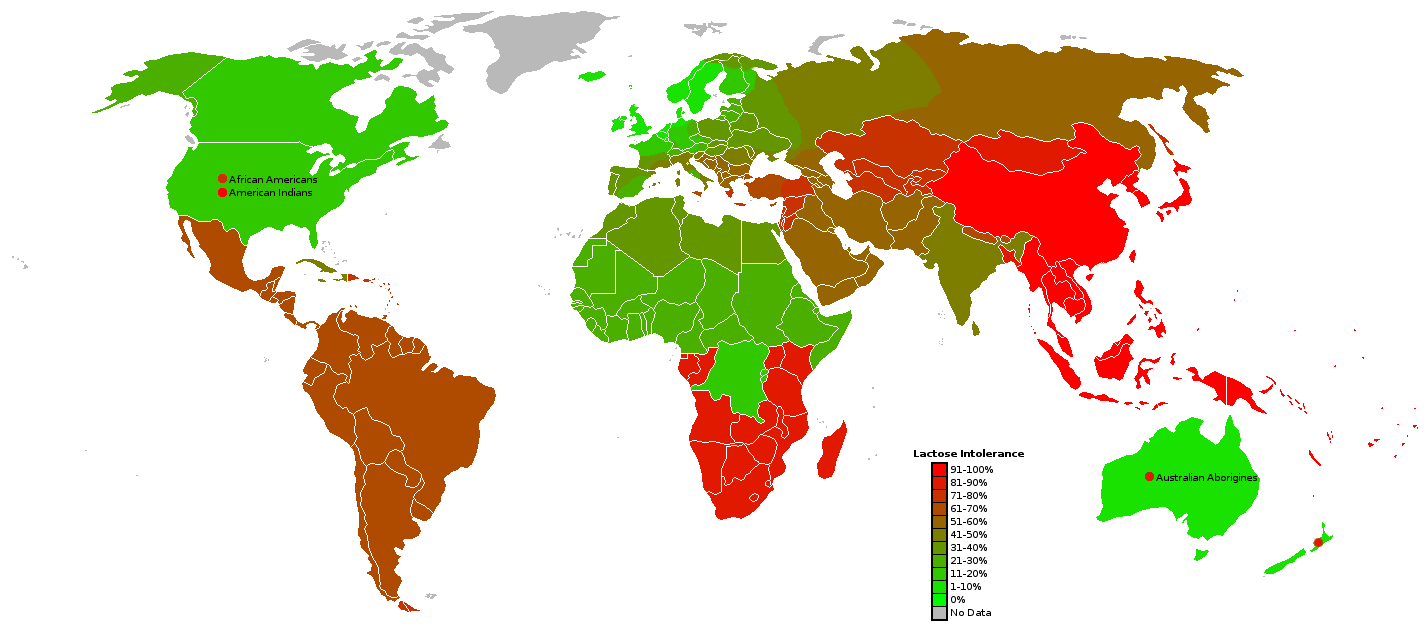
Approximately 90-95% of black individuals and 20-25% of white individuals throughout the world will have a partial or complete lactose intolerance. Most often people of African, Asian, and Mediterranean descent have it.
Most humans, like other mammals, gradually lose the intestinal enzyme lactase after infancy and with it the ability to digest lactose, the principle sugar in milk. At some point in prehistory, a genetic mutation occurred and lactase activity persisted in a majority of the adult population of North and Central Europe, and in some ethnic groups around the Mediterranean and Near East, in Noth Africa, and on the Indian subcontinent are those that have developed a gentic mutation to allow them to digest the lactose in milk. allowing carriers to have milk as a nutritional resource, especially useful in times of food shortage.
These people share the longest known tradition of dairying, since humans first domesticated livestock and practiced milk-based pastoralism (6000–9000 years ago), making milk abundant for adults.
Descendants of these polutations carried this genetic mutation with them to Noth America and Austalia.
For the majority of the world's populations, however, the absence of genetic challenge has meant that this genetic change did not occurred.
Lactose intolerance by group[]
| Human groups | Individuals Examined | Percent Intolerant |
Allele Frequency
|
| Basques | 85 | 0.3% | N/A |
| Dutch | N/A | 1% | N/A |
| Swedes | N/A | 2% | 0.14 |
| Europeans in Australia | 160 | 4% | 0.20 |
| Northern Europeans and ScandinaviansScandinavians | N/A | 5% | N/A |
| Danes | N/A | 5% | N/A |
| British | N/A | 5–15% | 0.184-0.302 |
| Swiss | N/A | 10% | 0.316 |
| European Americans | 245 | 12% | 0.346 |
| Tuareg | N/A | 13% | N/A |
| Germans | N/A | 15% | N/A |
| Eastern Slavs (Russians, Belarusians, Ukrainians) | N/A | 15% | N/A |
| Austrians | N/A | 15–20% | N/A |
| Northern French | N/A | 17% | N/A |
| Finns | 134 | 18% | 0.424 |
| Central Italian | 65 | 19% | N/A |
| Indians | N/A | 20% | N/A |
| African Tutsi | N/A | 20% | 0.447 |
| African Fulani | N/A | 23% | 0.48 |
| Bedouin | N/A | 25% | N/A |
| Portuguese | 102 | 35% | N/A |
| Southern Italian | 51 | 41% | N/A |
| African American | N/A | 45% | N/A |
| Saami | N/A | 25–60% | N/A |
| Northern Italian | 89 | 52% | N/A |
| North American Hispanic | N/A | 53% | N/A |
| Balkans | N/A | 55% | N/A |
| Mexican American | N/A | 55% | N/A |
| Cretans | N/A | 56% | N/A |
| African Maasai | 21 | 62% | N/A |
| Southern French | N/A | 65% | N/A |
| Greek Cypriots | N/A | 66% | N/A |
| Bangladesh | N/A | 70% | N/A |
| Jews, Mizrahi (Iraq, Iran, etc) | N/A | 85% | N/A |
| Jews, North American | N/A | 68.8% | N/A |
| Jews, Sephardic | N/A | 62% | N/A |
| Jews, Yemenite | N/A | 44% | N/A |
| Sicilians | 100 | 71% | N/A |
| South Americans | N/A | 65–75% | N/A |
| Rural Mexicans | N/A | 73.8% | N/A |
| African Americans | 20 | 75% | 0.87 |
| Kazakhs | 195 | 76.4% | |
| Lebanese | 75 | 78% | N/A |
| Central Asians | N/A | 80% | N/A |
| Alaskan Eskimo | N/A | 80% | N/A |
| Australian Aborigines | 44 | 85% | 0.922 |
| Inner Mongolians | 198 | 87.9% | |
| African Bantu | 59 | 89% | 0.943 |
| Asian Americans | N/A | 90% | N/A |
| Northeastern Han Chinese | 248 | 92.3% | |
| Chinese | 71 | 95% | 0.964 |
| Southeast Asians | N/A | 98% | N/A |
| Thai | 134 | 98% | 0.99 |
| Native Americans | 24 | 100% | 1.00 |